
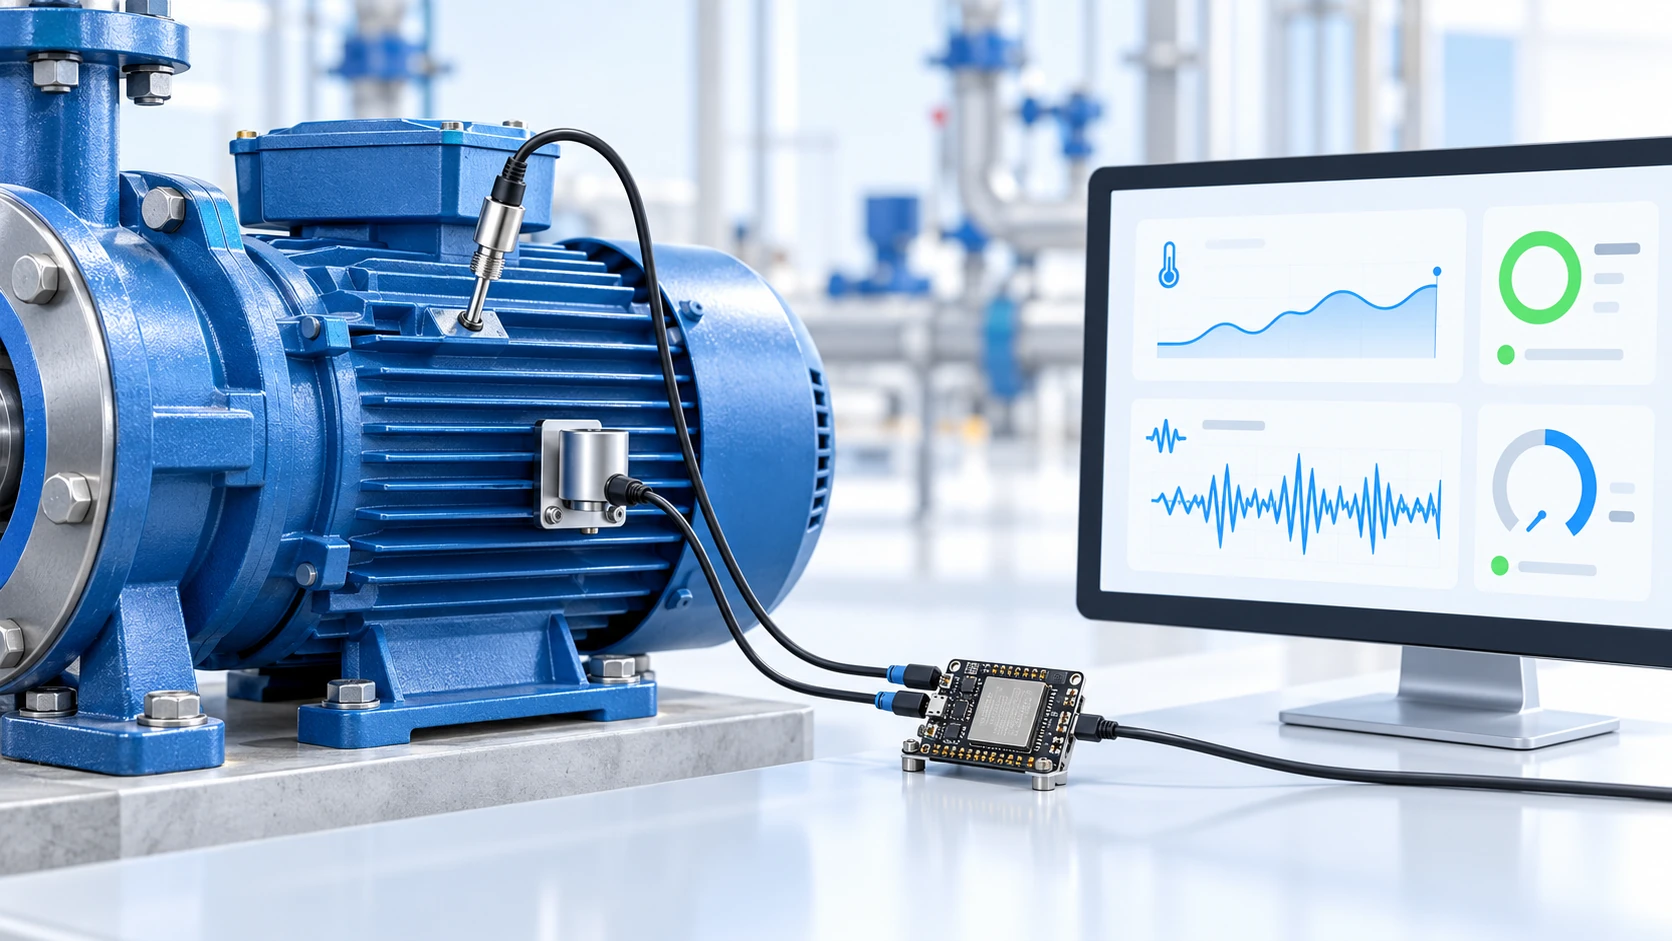
Motor temperature and vibration monitoring with ESP32
Predictive maintenance node with MPU6050 and a Type K thermocouple: vibration RMS, MQTT telemetry and a mechanical trend becoming a useful SCADA alarm.
Hardware requirements:
- Placa ESP32-WROOM-32 ou ESP32-S3
- Acelerômetro triaxial MPU6050
- Módulo MAX31855 compatível com termopar Tipo K
- Termopar Tipo K instalado por profissional habilitado
- Fonte regulada de 5 V e gabinete protegido para o nó sensor
Download this tutorial's materials:
- Projeto completo (ZIP)494 KBplatformio.ini, firmware com leitura I2C e SPI, cálculo RMS, pico, fator de crista, MQTT com Last Will, README e manual em PDF.
- Manual em PDF (6 páginas)606 KBMontagem, ligações, linha de base, qualidade do dado, histerese, integração MQTT/SCADA, testes seguros e solução de problemas.
Want to receive new manuals and industrial schematics? Join our channel on Telegram / WhatsApp
Before powering anything: this is not a safety instrument
An ESP32 with an MPU6050 and MAX31855 is an excellent acquisition and trending node for laboratories, prototypes and predictive maintenance. It helps identify that a motor is heating or vibrating more than its own baseline.
It does not replace a thermal relay, overcurrent protection, certified industrial sensor, dedicated vibration monitor or any safety interlock. Do not install, adjust or open a box near an energized motor without electrical qualification and the plant's lockout/tagout procedure.
This tutorial has a specific goal: measure repeatably, preserve the context of each reading and publish a trend that someone can interpret before a failure.
What the node measures
The MPU6050 measures acceleration on three axes. On a motor housing, vibration can appear as an increase in RMS, a change in energy distribution or periodic components in the spectrum. The sensor is inexpensive and useful for experiments, but its mechanical mounting, range and bandwidth are not equivalent to an industrial accelerometer.
The MAX31855 converts a Type K thermocouple signal and reports hot-junction temperature and possible thermocouple faults. It uses SPI and must not be confused with a digital ambient-temperature sensor: the thermocouple needs a defined mounting point on the housing, with suitable mechanical contact and electrical isolation.
The ESP32 collects both signals, calculates simple indicators and sends an MQTT payload like this:
| 1 | { |
| 2 | "ts": 1755990000, |
| 3 | "temperature_c": 67.4, |
| 4 | "vibration_rms_g": 0.082, |
| 5 | "vibration_peak_g": 0.31, |
| 6 | "crest_factor": 3.78, |
| 7 | "quality": 192, |
| 8 | "sample_count": 128 |
| 9 | } |
The timestamp is the reading time, not the moment the broker received the message. Quality tells you whether the value is trustworthy. Without those two fields, a chart can look precise and still lead to the wrong decision.
Mounting matters more than the dashboard
Stick the MPU6050 on with double-sided tape and the sensor starts measuring the tape, the enclosure and any looseness. For trend comparison, use a rigid, repeatable mounting method, preferably a screw or a metal base designed for the measurement point.
Mark the position and axis orientation. If every maintenance visit changes the side of the housing, the RMS is no longer comparable. Do not mix measurements from the bearing, motor end cover and base as if they were the same point.
The thermocouple also needs a defined position. Housing temperature depends on load, ventilation, ambient temperature and operating time. Record at least motor state and time since start when comparing different days.
Electrical connections
The MPU6050 uses I2C. This example uses SDA on GPIO 21 and SCL on GPIO 22. The most common address is 0x68; if AD0 is high, it becomes 0x69.
The MAX31855 uses SPI: GPIO 18 for SCK, GPIO 19 for MISO and GPIO 5 for CS. MOSI is not needed to read this converter. Check your module pinout: boards from different manufacturers can change the silkscreen and power regulator.
All modules must share the ESP32 GND. Keep the low-voltage bus physically separate from power conductors and variable-frequency-drive cables. Electrical noise is not solved by changing libraries alone.
Freeze the environment before measuring
Create the project in PlatformIO and pin the libraries. The goal is to prevent two builds from installing different APIs without anyone noticing.
| 1 | [env:esp32-motor-monitor] |
| 2 | platform = espressif32 |
| 3 | board = esp32dev |
| 4 | framework = arduino |
| 5 | monitor_speed = 115200 |
| 6 | lib_deps = |
| 7 | adafruit/Adafruit MPU6050@^2.2.6 |
| 8 | adafruit/Adafruit BusIO@^1.16.2 |
| 9 | adafruit/Adafruit MAX31855 library@^1.4.2 |
| 10 | knolleary/PubSubClient@^2.8 |
| 11 | bblanchon/ArduinoJson@^7.2.1 |
Start with the ESP32 on the bench, without the motor or MQTT. First confirm that the MPU6050 responds on I2C, then check the MAX31855 reading, and only then enable continuous acquisition.
Reading the MPU6050: the raw number is not the diagnosis
The accelerometer provides acceleration on the X, Y and Z axes. Gravity appears as a continuous component, so a board sitting still on the bench still reads about 1 g on one axis. To study vibration, remove each window's mean before calculating RMS.
A 128-sample window at 1 kHz lasts about 128 ms, which is the window used by the kit firmware. That is suitable for slow trending, but it does not turn the MPU6050 into a high-frequency vibration analyzer: a short window means coarse frequency resolution and is the first parameter to increase when RAM allows.
| 1 | // Remove the window mean before RMS: the mean carries |
| 2 | // gravity, which is continuous and is not vibration. |
| 3 | float rmsWithoutGravity(const float* samples, size_t n) { |
| 4 | if (n == 0) return 0.0f; |
| 5 | float mean = 0.0f; |
| 6 | for (size_t i = 0; i < n; ++i) mean += samples[i]; |
| 7 | mean /= static_cast<float>(n); |
| 8 | float sumSquares = 0.0f; |
| 9 | for (size_t i = 0; i < n; ++i) { |
| 10 | const float ac = samples[i] - mean; |
| 11 | sumSquares += ac * ac; |
| 12 | } |
| 13 | return sqrtf(sumSquares / static_cast<float>(n)); |
| 14 | } |
RMS measures the window's average energy. It does not identify the cause by itself. Misalignment, a damaged bearing, a loose base and a load change can all increase the same indicator.
Peak and crest factor
Also keep the largest absolute value in the window. The relationship between peak and RMS is the crest factor:
| 1 | crest factor = peak / RMS |
A slowly growing RMS may indicate wear or imbalance. A high crest factor while RMS is still low can reveal short impacts, looseness or the beginning of bearing damage. Do not use a universal number to separate normal from failure: build a baseline for your machine, mounting and known load.
Where FFT helps
RMS answers how much energy exists in the window. FFT helps answer where that energy is. The result can show a component near rotation speed, harmonics and bands that deserve investigation.
For a first version, do not run FFT in the same loop that must keep the network and alarms responsive. Collect the window, signal that it is ready, process it in a controlled stage and publish the summary. The dashboard should receive useful indicators, not thousands of context-free samples.
FFT resolution is approximately sample rate divided by the number of points. At 1 kHz with the kit's 128 samples, each bin covers about 7.8 Hz — too coarse to separate rotation from a harmonic in a 1,750 rpm motor, which turns at 29 Hz. To approach 1 Hz per bin, you need 1,024 points at the same rate. No resolution fixes poor mounting or removes inverter noise.
Temperature: treat faults as poor quality
The MAX31855 can report an open circuit, short circuit or conversion error. In any of those conditions, do not publish zero as if it were a valid temperature. Zero is a possible value; the quality field exists precisely to distinguish a value from a fault.
A simple convention for this project is:
| 1 | 192 good valid thermocouple, synchronized clock, normal reading |
| 2 | 64 uncertain clock has no NTP yet or value is outside the expected range |
| 3 | 0 bad open thermocouple, short circuit or sensor unresponsive |
If temperature leaves a plausible range, record the cause and publish uncertain or bad quality as appropriate. Do not hide the diagnosis by replacing the reading with 0, 999 or the last value without marking it stale.
Alarms need hysteresis
A single threshold toggles an alarm on every reading when the value sits near the boundary. Use two thresholds: one to turn it on and another to turn it off.
For example, a provisional policy might turn on a thermal alert above 80 °C and turn it off only below 75 °C. These values are examples; the real threshold depends on the motor, insulation class, load, manufacturer and measurement method.
For vibration, prefer evaluating the trend and relative change over the baseline. An absolute limit copied from a generic table can produce a false alarm on one machine and miss another. ISO 10816/ISO 20816 should guide application engineering, not serve as an automatic certification for an MPU6050 mounted on a development board.
MQTT publication: the SCADA contract
Use a stable topic per quantity and put values in the payload. One hierarchy example is:
| 1 | plant1/line2/motor03/telemetry |
| 2 | plant1/line2/motor03/status |
| 3 | plant1/line2/motor03/alarms |
Retain the latest telemetry state and gateway status, but do not retain commands or momentary alarms. A retained command can be executed again when SCADA reconnects. Status should contain uptime, RSSI, firmware version and the reason for the last reset.
MQTT Last Will should publish offline if the gateway loses its connection without saying goodbye. On connect, publish online with retention. SCADA can then distinguish a stable motor from a dead gateway.
Acquisition and publication code
The snippet below is an integration baseline. It shows the order of the safeguards, not an industrial performance certificate. The rest of the firmware must handle Wi-Fi, NTP, non-blocking MQTT reconnection, watchdog and configuration storage.
| 1 | #include <WiFi.h> |
| 2 | #include <PubSubClient.h> |
| 3 | #include <Adafruit_MPU6050.h> |
| 4 | #include <Adafruit_MAX31855.h> |
| 5 | #include <ArduinoJson.h> |
| 6 | #include <time.h> |
| 7 | Adafruit_MPU6050 mpu; |
| 8 | Adafruit_MAX31855 thermocouple(18, 5, 19); |
| 9 | WiFiClient wifiClient; |
| 10 | PubSubClient mqtt(wifiClient); |
| 11 | constexpr size_t WINDOW = 128; |
| 12 | constexpr uint32_t SAMPLE_INTERVAL_US = 1000; |
| 13 | float magnitude[WINDOW]; |
| 14 | // Cadence comes from an accumulated deadline, not a delay after reading. |
| 15 | // With delay, I2C transaction time is added on every pass and the real |
| 16 | // rate falls below 1 kHz, invalidating later frequency calculations. |
| 17 | void collectWindow() { |
| 18 | uint32_t next = micros(); |
| 19 | for (size_t i = 0; i < WINDOW; ++i) { |
| 20 | while ((int32_t)(micros() - next) < 0) yield(); |
| 21 | next += SAMPLE_INTERVAL_US; |
| 22 | sensors_event_t acceleration, gyro, temperature; |
| 23 | mpu.getEvent(&acceleration, &gyro, &temperature); |
| 24 | const float ax = acceleration.acceleration.x / 9.80665f; |
| 25 | const float ay = acceleration.acceleration.y / 9.80665f; |
| 26 | const float az = acceleration.acceleration.z / 9.80665f; |
| 27 | magnitude[i] = sqrtf(ax * ax + ay * ay + az * az); |
| 28 | } |
| 29 | } |
| 30 | bool clockSynchronized() { |
| 31 | return time(nullptr) > 1700000000; |
| 32 | } |
| 33 | void publishSummary(float rms, float peak, float temperatureC, int quality) { |
| 34 | JsonDocument doc; |
| 35 | doc["ts"] = clockSynchronized() ? (uint32_t)time(nullptr) : 0; |
| 36 | doc["temperature_c"] = temperatureC; |
| 37 | doc["vibration_rms_g"] = rms; |
| 38 | doc["vibration_peak_g"] = peak; |
| 39 | doc["crest_factor"] = rms > 0.001f ? peak / rms : 0.0f; |
| 40 | doc["quality"] = quality; |
| 41 | doc["sample_count"] = WINDOW; |
| 42 | char payload[384]; |
| 43 | serializeJson(doc, payload, sizeof(payload)); |
| 44 | mqtt.publish("plant1/line2/motor03/telemetry", payload, true); |
| 45 | } |
The snippet reduces each pass to one number, the magnitude of the acceleration vector, and calculates RMS from it — the same approach used by the kit firmware so the article and package values remain comparable. Magnitude is practical for trending but collapses three directions into one scalar and loses axis information; for diagnosis, store RMS for each axis separately. For spectral analysis, increase the window as RAM allows, apply a mathematical window before FFT and validate the real sample rate with a known signal. Do not use a long delay() while trying to keep heartbeat, MQTT and watchdog alive.
Bench validation order
Step 1: confirm power and buses
With the motor off and the assembly outside the hazard area, run an I2C scanner. The MPU6050 must appear at 0x68 or 0x69. Then read the MAX31855 with the thermocouple at room temperature and confirm there is no open-circuit flag.
Step 2: validate gravity
With the sensor still, rotate the board slowly around each axis. Resultant acceleration should remain near 1 g, allowing for tolerance and noise. If the value varies substantially while still, review power, mounting and accelerometer range configuration.
Step 3: create the baseline
Record several minutes with the motor unloaded, then under a known load condition. Save RMS, peak, crest factor, temperature, speed and time. A baseline without load context is not a baseline; it is just a number.
Step 4: compare orientation and position
Take a second measurement on the same motor, at the same point and with the same orientation. If repeatability varies more than the trend you want to detect, the problem is still mechanical or in acquisition, not MQTT.
Step 5: test a simulated fault safely
Do not loosen a screw, remove a guard or introduce a fault into an energized machine. To test the pipeline, publish test values to a separate topic or use a load generator controlled by engineering. The alarm must appear, remain while the condition exists and disappear only after hysteresis.
Step 6: test a network outage
Take the broker down for a few minutes while the sensor reads. Firmware must continue collecting or explicitly signal that it cannot preserve the window, without blocking the entire loop. When the network returns, publish the reading timestamp, not the reconnection time.
Step 7: test restart and quality
Power the gateway off deliberately. SCADA must mark status offline through Last Will or missing heartbeat. Disconnect the thermocouple on the bench and confirm that temperature does not become zero with good quality.
Errors that look like sensor problems
RMS rises when someone touches the enclosure. The mounting is measuring the enclosure itself or a cable is loose. Reinforce the mounting and repeat the baseline.
Temperature stays at 0 °C after a fault. Firmware is hiding a thermocouple error. Separate value from quality and handle the MAX31855 flag.
The chart changes when motor load changes. That may be normal process behavior. Publish load, speed or operating state alongside telemetry.
The alarm oscillates near the limit. Hysteresis, minimum dwell time or an evaluation window is missing.
SCADA shows everything at the same time. The timestamp is being created by the broker or consumer. Timestamp the reading on the ESP32 after clock synchronization.
FFT peaks change on every reading. The window is too short, the sensor is loose, sample rate is unstable or aliasing is present. Validate acquisition before interpreting the spectrum.
The gateway reboots when it publishes. Check power, heap, JSON size and TLS cost. Log the reset reason and observe free memory before and after the connection.
The project claims ISO compliance just because it calculated RMS. RMS is an indicator; compliance depends on sensor, mounting, bandwidth, calibration, procedure and machine assessment.
The expected result is a trend reliable enough to guide an inspection: temperature, vibration, quality and context in the same history. The decision to stop or release a motor remains with the engineering team responsible for the machine.